Devopsdays Amsterdam 2018: workshops
Table of Contents
Just like the previous couple of years, devopsdays Amsterdam started off with a day of workshops. This year I attended workshops about Go, monitoring microservices and Kubernetes.
Go for Ops — Michael Hausenblas (Red Hat)
Michael walked us through the features of the Go language by giving numerous examples. This is a workshop that usually takes a full day so we were in for a nice ride.
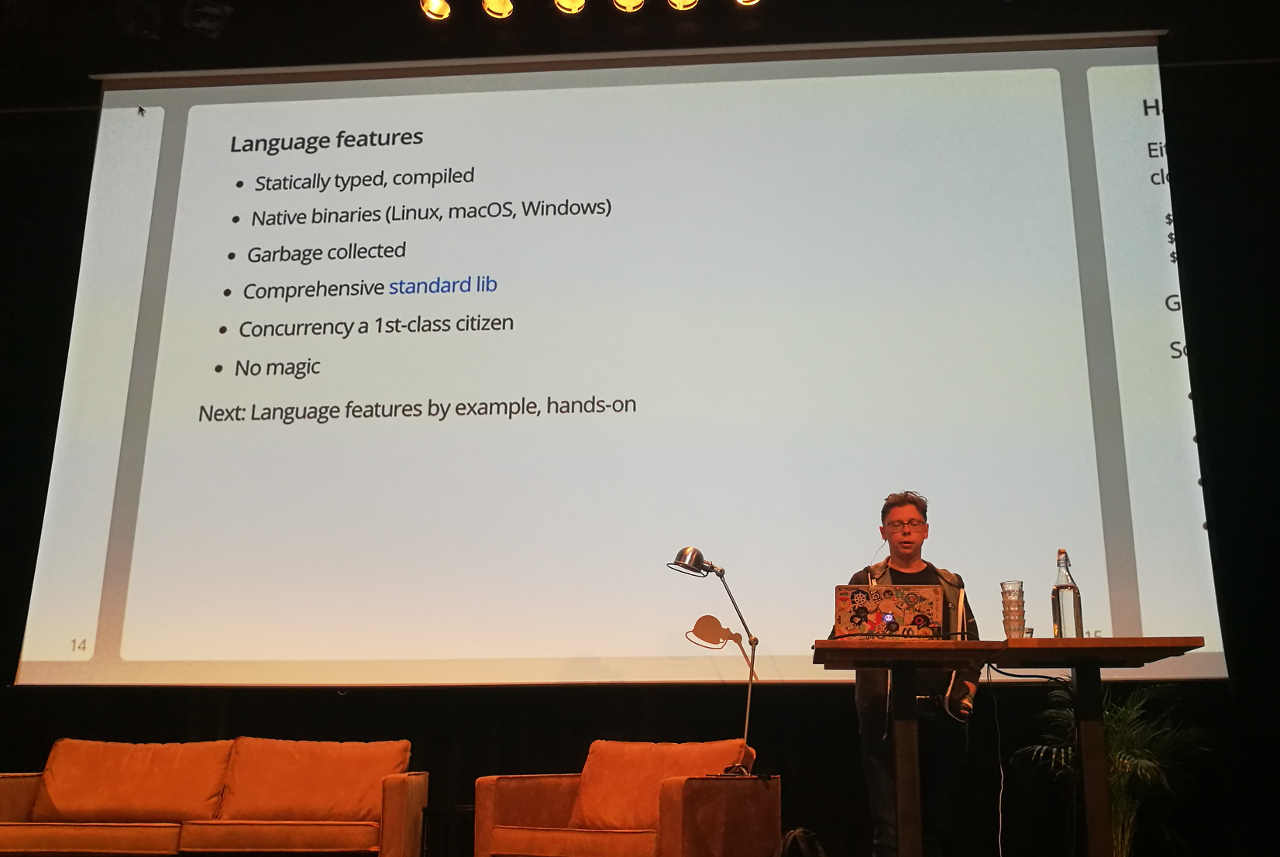
One thing he mentioned that he liked about the language is that there is (almost) no magic involved.
Some things that stood out to me, Mark, (as someone who writes Python most of the time and does not know much about Go):
- There are no objects in Go; they are “structs” and methods (functions bound to a struct) (Note from Mark: Steve Francia wrote “Is Go an Object Oriented language?” which seems like a useful article).
- You need to create a file first before you can write to it. (In Python you open a file for writing and it is created if needed).
- To format dates you have to use a special date in the formatter: Jan 2, 15:04:05, 2006 (which is basically 1, 2, 3, 4, 5, 6).
- The standard library is very comprehensive. (This is actually something Go has in common with Python.)
- Code formatting is enforced via
gofmt.
Common pattern to handle errors:
  mail, err := mailof(uid, aproject)
  if err != nil {
      ...
      os.Exit(1)
  }
Slide 27:
if you feed the printf function a different type, e.g. a string, it will not
even compile. (Mark: this is something I’m not used to, coming from Python.)
To expose things like functions (make them available to other packages): start the name with an uppercase letter. Functions starting with a lowercase letter are internal/private to the package. If you try to access an internal function, you get a nice error message (again: at compile time).
Slide 31: “log.Fatalf()”
triggers the os.Exit(1) you can see when you run this example.
You can add a call to the defer function at the end of a scope (e.g. “defer f.Close()”
in slide 33).
Since the Go runtime will execute this always (even if there was an error), you can
use this e.g. as a cleanup of an open file. You can have as many defers as you
like; they will be executed in reverse order.
Starting with writing tests is quite simple: create file with <module name>_test.go.
The function name of the test is irrelevant as long as it starts with “Test”.
Run the tests with “go test” (plus options, if you like). Go offers test
coverage information. Tip: use a nice editor/IDE and integrate running the tests
and code coverage there.
As you can see on slide 39 it is possible to add encodings to your struct to be able to, for instance, encode and decode JSON. There are other encodings, see e.g. https://pkg.go.dev/encoding#section-directories
Google, where Go was created, uses a monorepo. As a result they did not need dependency management in Go. Use e.g. dep to help you out here. It looks like vgo will be part of the language in the future.1
You can either trust upstream (and Github to be available) and not put your dependencies in your repo, or chose not to and version control the code you depend on yourself.
About running a Go application in a container: you can either pick an image with
debug tools (like centos:7), or pick a minimal image like alpine or
scratch as the basis of your image. You have to decide whether you want the
smallest image possible or want (some) tools included.
For Michael, Go replaced a lot of Bash and Python. However, Michael is not convinced that Go is a good fit to write a complete web application in, for instance. But decide for yourself. On slide 56 there are a couple of links to some pages with criticism.
As already stated, Go has an extensive standard library. Michael advises to use it. If it does not have or do what you want, your second best option is to use a drop-in replacement. Only if that is not possible, search for a package with a different API.
Useful resources:
- The sheets for this workshop can be found via https://go-talks.appspot.com/github.com/mhausenblas/go4ops/main.slide#1.
- Go by example is a nice resource to learn about the concepts in Go.
- https://goreportcard.com/
- https://golang.org/doc/
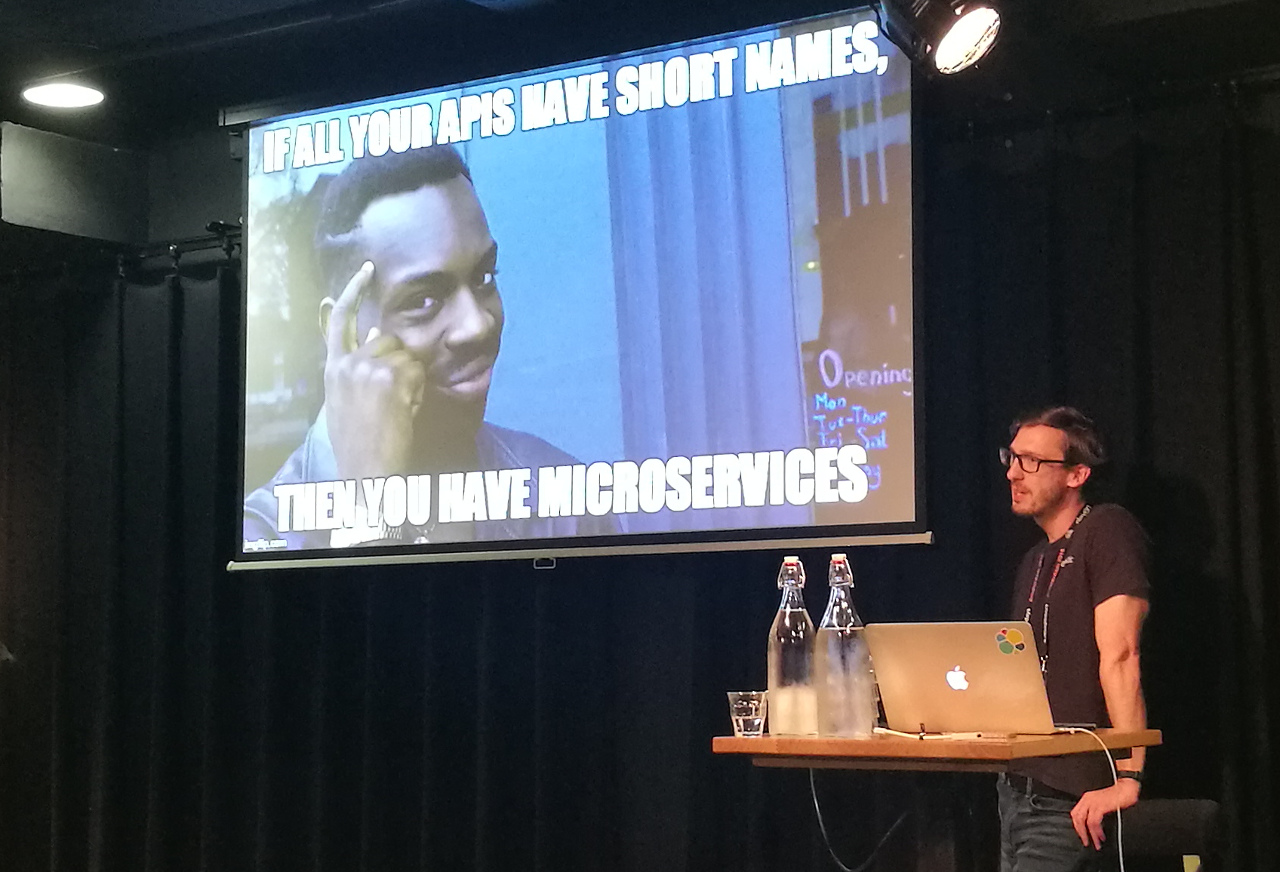
Monitor Your Microservices — Logs, Metrics, Pings, And Traces — Philipp Krenn (Elastic)
Distributed services make debugging … interesting.
The code for this workshop, a highly monitored “hello world” app can be found on Github.
The server provided for the workshop is an Amazon Lightsail instance created with Terraform and provisioned with Ansible. (The code for this deployment is also included in the aforementioned repo.)
Notable changes in Kibana 6.3:
- It has tools to manage the Elasticsearch indices.
- In visualizations the aggregation previously called “calculation” has been renamed to “math.”
Packetbeat is using libpcap, just like Wireshark. Philipp thinks the future of Packetbeat is in tracking down DNS + TLS errors since you should encrypt the data between your services (which means that Packetbeat can no longer extract much information from the packets).
Previously you used Logstash to get the Nginx access logs into Elasticsearch. Filebeat modules can help you there. Filebeat is just forwarding the data; the parsing is done by Elasticsearch. Filebeat has processors to enrich events with e.g. cloud and host metadata (quite cheaply actually since this information is collected on startup of Filebeat and cached).
Auditbeat has the same type configuration as auditd.
Journalbeat (from a third party) can be used for journald support. Philipp doesn’t guarantee anything, but this is on the list of the Elastic team and he hopes there will be official support for journald.
You can have a rule to collect multiline messages, like stack traces, together in one document by telling Filebeat that if a line start with e.g. a timestamp, it is the start of a new line and if it starts with e.g. a space it is part of a stack trace. You could also use structured logs (which is recommended if you can).
As of version 6 you can tell beats to enable (and update) the related dashboards in Kibana.
For alerting with the Elastic stack you need a commercial license.
The machine learning (also only available in the commercial X-Pack license) takes three iterations to detect a pattern. For example the pattern of how much traffic your application receives on a workday can be learned in three days. For a weekday/weekend pattern, it would need three weeks.
Kibana also has support for APM (Application Performance Monitoring). There are agents for e.g. Python and Node and a bunch of others (some in beta or alpha stage, see the docs).
Elastic is working on Index Lifecycle Management (ILM) which will run as part of the cluster. Philipp is not sure when it will be available though. For now use Curator.
Elasticsearch already supports metrics aggregation (called “rollups”) via the API. In a future version there will also be an graphical interface to configure this.
Philipp compared his workshop to Lego. He showed us some configuration, visualizations, etcetera but “some assembly is required.”
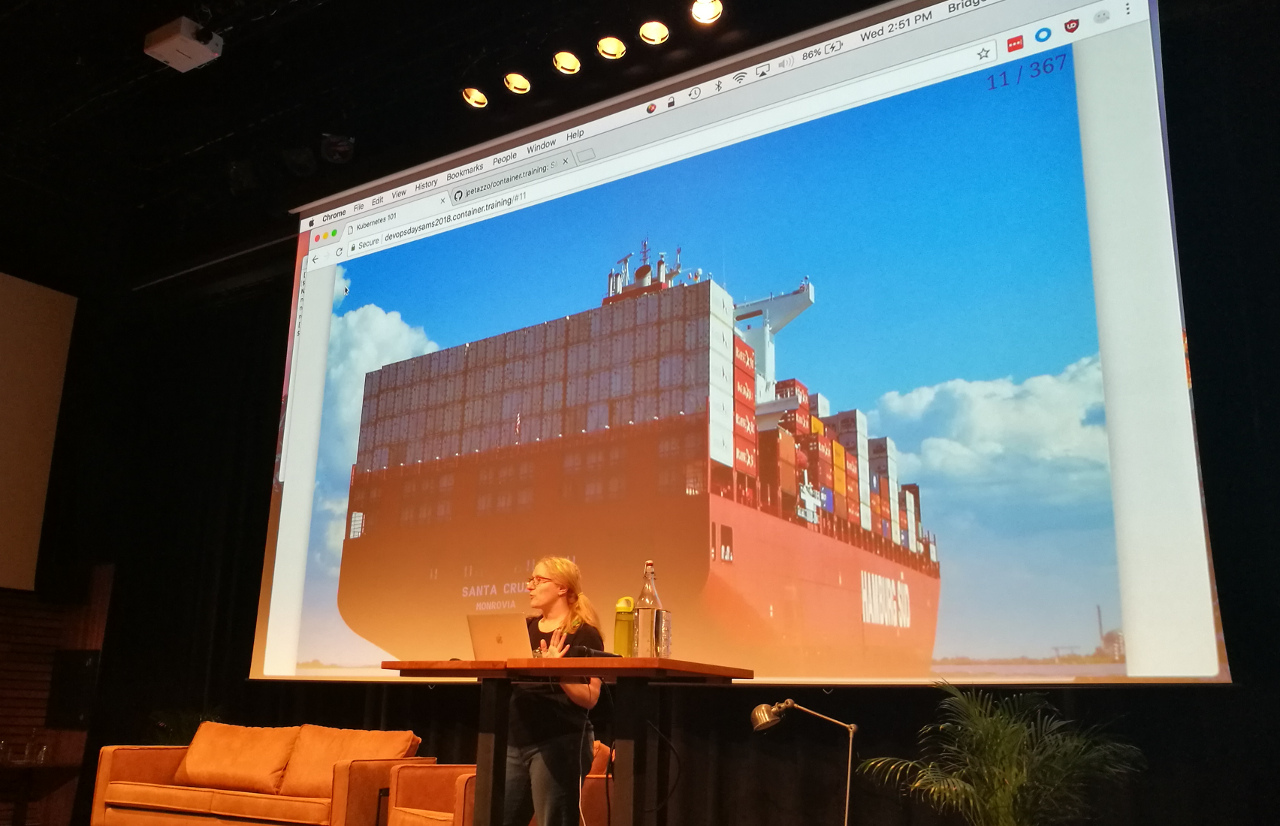
Kubernetes 101 — Bridget Kromhout (Microsoft)
This was a fast paced, highly interactive workshop about Kubernetes so I only took a few notes. However, the slides have so much information on them, you can follow the workshop perfectly fine without comments from me.
Resources:
- Slides: https://devopsdaysams2018.container.training/
- Git repo: https://github.com/jpetazzo/container.training
Warning: we have done stuff you should not do in production. :)
Kubernetes is highly unopinionated.
By default Kubernetes uses one big, flat network. However, you can configure Kubernetes so that customers cannot access each other.
In real life you would not host your own Docker registry in the production environment. We do it in the workshop because it is easier than messing with credentials to other registries.
Kubernetes has extensive role based access control support.
-
Update 2021-10-08: According to the
debrepository:Dep was an official experiment to implement a package manager for Go. As of 2020, Dep is deprecated and archived in favor of Go modules, which have had official support since Go 1.11. For more details, see https://golang.org/ref/mod.
↩︎